Get the big ‘data visualisation’ picture
Using data led storytelling to improve understanding of key challenges.
Sarah ShooterEditorial Content Manager, RSSB
We are trusted by industry to collect data from across the sector, for the benefit of everyone in rail—but gathering data is just the start of the story. Our new Graphic Insights series, combines digital capabilities and expert knowledge. The goal is to explore industry challenges and signpost to the tools and resources you need to drive improvements.
With this clear format, our insights will support members to make informed decisions, to make the railway safer. Each Graphic Insight paints a comprehensive overview of a safety challenge. It then shares the products and services available to tackle it.
The first set of interactive stories we have created shed new light on three such industry challenges. These are track worker safety, workplace health and wellbeing (H&W), and signals passed at danger (SPADs).
We are really proud of our initial set of Graphic Insights, they demonstrate RSSB's data leadership in rail alongside our technical expertise. Each is designed to deliver expert knowledge, and signpost to the RSSB services and resources that could drive improvements. We are already working on the next set of data-led stories and are always open to suggestions from our members.
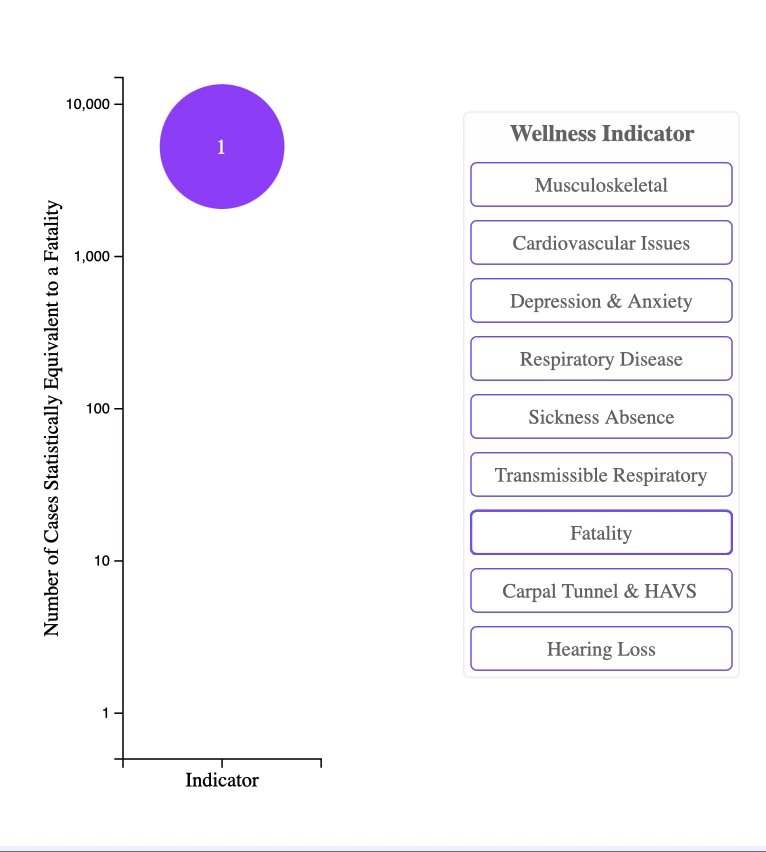
A productive and harmonious workplace is the result of a healthy workforce. By gathering H&W data from across industry, we can see challenges and guide investment decisions to improve workforce health. Our Graphic Insights show how improving H&W can reduce the 1,346,659 days rail loses to sickness. These cost the industry approximately £356 million—annually.
Key tools for tackling poor H&W is the Health and Wellbeing Data Hub, a new performance management system being piloted by 21 companies. The self-reported data is used to determine the companies’ H&W as a whole, create a benchmark upon which improvements can be built, and compare sickness and absence data with that of other, anonymised, companies.
Want to know more?Learn more about our work in the area of health and wellbeing data.
View page
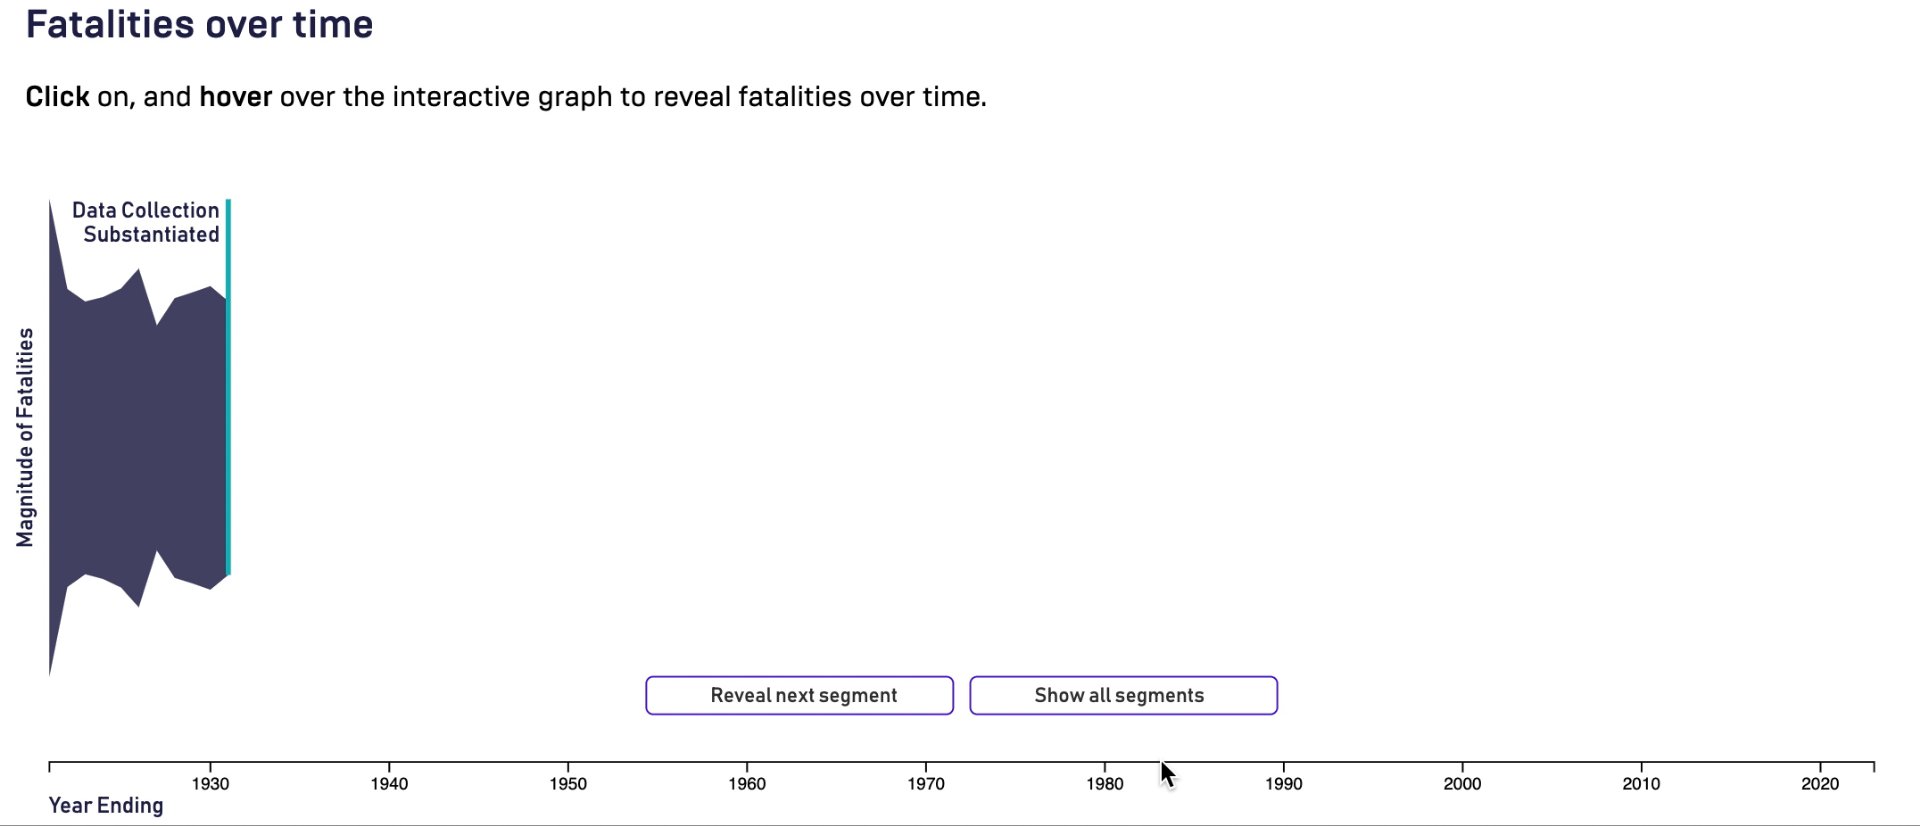
The safety of track workers is of paramount concern to everyone, and this Graphic Insight builds on existing material to display data on how workforce fatalities have declined over the past 100 years alongside relevant historical events and legislation, to show how far we’ve come. We also evidence the efficacy of current track worker safety risk management and see how far we still have to go.
Want to know more?View information and links to relevant material for support with managing track worker safety risks.
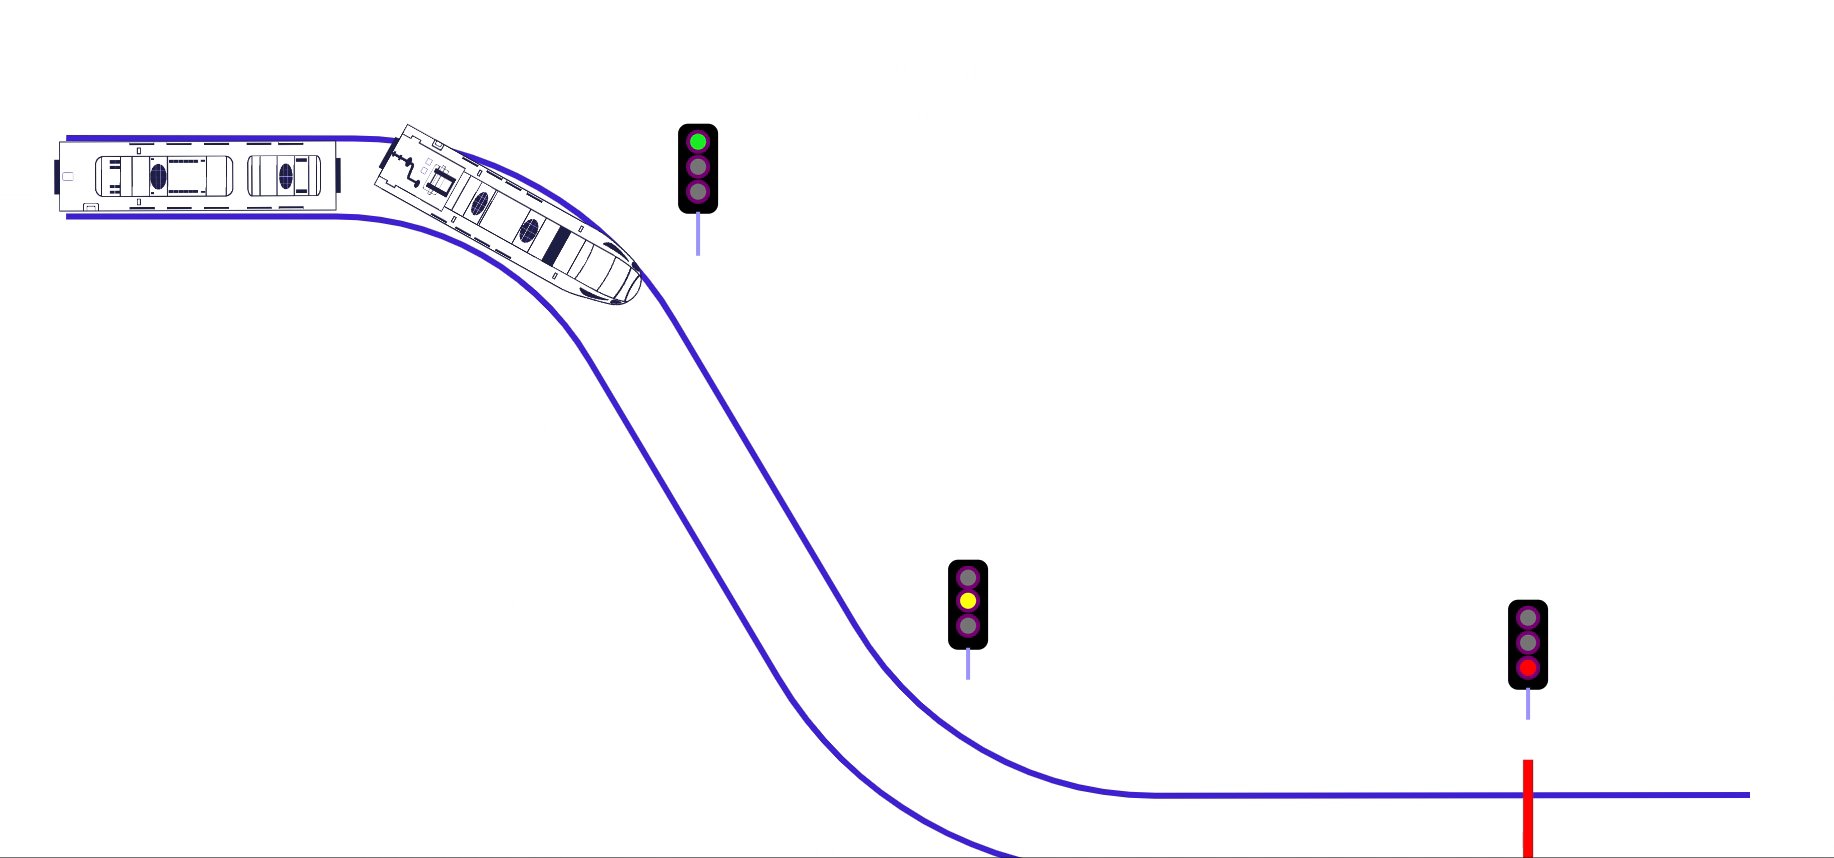
SPADs remain among the most dangerous risks in rail. Our SPADs Graphic Insight opens with an interactive incident model, showing how they are caused, highlighting the special conditions that can compound them and what their consequences can be.
A closer look at SPAD risk over time not only gives visual evidence of how significantly SPAD risk has decreased, but also looks at how much more they can be realistically reduced.
We also take a more granular look and compare data from passenger trains, freight and engineering trains, and empty coaching stock.
Want to know more?Find out about how SPAD data is monitored and analysed to reduce and prevent these events.
All this knowledge, and more, is now at your fingertips. Challenge your preconceptions about key rail industry challenges. Find out which of RSSB’s products and services could save your company money and time while driving safer practices to make healthier decisions for rail workers.
Level Crossings
Road Risk
Public Behaviour
Station Operations
Train Operations
Workforce Safety