Leveraging SMIS data to drive safe freight growth
The safety insights in the Freight Safety Data Hub will be vital in the rail freight expansion journey.
Jasmin CollierEditorial Content Manager, RSSB
With the challenge to increase rail freight by 75% in the next 25 years, we know many freight businesses are striving for scalable, sustainable growth. But they’re also seeking improvements in safety, health, and wellbeing, ensuring that expanding their operations won’t detract from these important areas.
The National Freight Safety Group (NFSG) that we facilitate understands these dual needs on a deep level. Its aim is to support the sector in achieving these goals by ‘cooperating and collaborating in managing system risk’.
That’s what led to the development of the Freight Safety Data Hub. Providing key industry insights for our freight members, the NFSG-facilitated data hub supports evidence- and risk-based decision making.
The information provided is based on entries to the Safety Management Intelligence System. This means it relies on the detail and accuracy of those inputs to generate meaningful, high-quality data insights.
The interactive Freight Safety Data Hub features 12 key safety indicators. Those are:
personal injuries
signals passed at danger (SPADs)
derailments on the running line
collisions
instances of the handbrake being left on
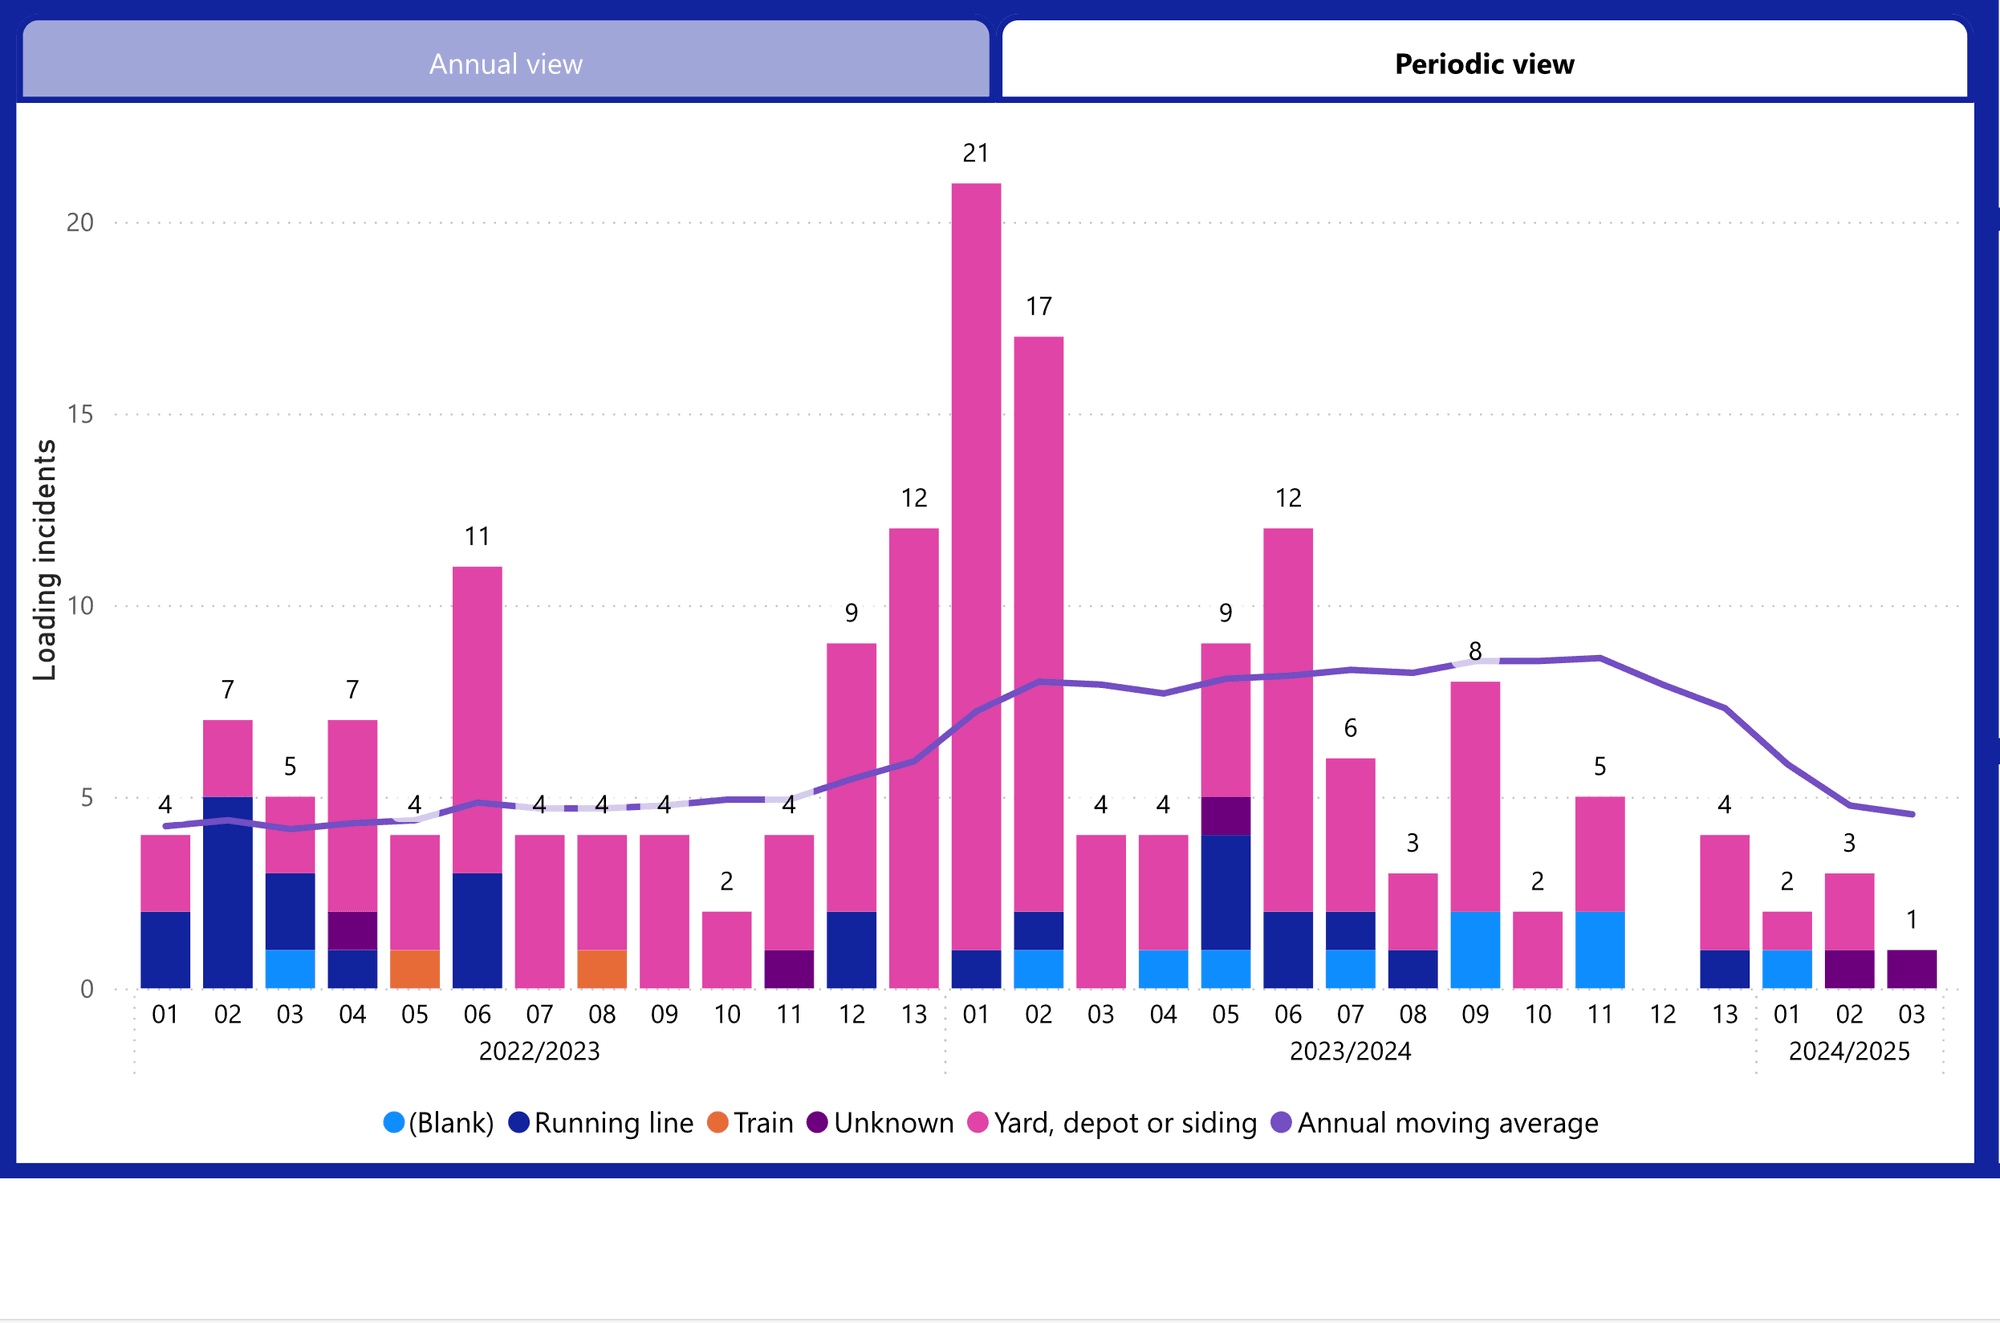
loading incidents
dangerous goods incidents
wheel impact load detection
rolling stock defects
divided train incidents
trespass and vandalism
road traffic accidents.
Monitoring this comprehensive collection of safety metrics will give freight businesses a solid understanding of the sector’s risk profile.
For example, for Period 2 2024/2025, we can see that the rates of most safety incident types are reducing. That’s with the exception of collisions, where the rate has increased over the past year.
Users can click into any of the 12 metrics listed above to explore the area further. Doing so will display a brief definition of the given incident and a graph of all logged incidents over a period.
It’s also possible to toggle between the annual view and the periodic view of these incidents. Or users can set their own custom time range.
Those graphs also show break these incidents down into the regions in which they occurred. This gives the user a good idea of areas that may be particularly problematic or where targeted improvements may be warranted.
For each of the 12 safety indicators, users can also choose to view by location type. The options provided depend on the incident type, but they include level crossings, yards, depots, sidings, and the running line.
For those looking for a granular view, some metrics also let users filter by:
injury degree
collision type
risk ranking (for SPADs).
Freight growth is just one part of the equation for many businesses. That growth has to be safe and sustainable. The Freight Safety Data Hub is a valuable resource for freight companies—and other industry stakeholders—looking to learn more about current incident trends and where improvements can be made, and then monitoring changes to ensure that they’ve had the desired safety impact.
Vitally, because it pulls the information directly from SMIS, the hub provides solid evidence from across the sector, allowing rail leaders to invest and improve accordingly.
Note: Please do not share the data in the hub outside of your organisation.
The Rail Health and Safety Strategy sets out the strategic roadmap of future work to support safe freight growth over the next five years. It maps out developing a single-source approach for freight data and a metric for freight wagon failure risk. These will be the first steps towards a freight precursor indicator model, allowing even better evidence and risk-based decision making in the future.
To see the full Freight Safety Data Hub, head to the dedicated page on our website.
View page
Yes, very much so!
There were some useful takeaways.
Not so relevant to me at this time.